Why Walter?
Named after Walter Shewhart, the father of Statistical Process Control
Process Behaviour Charts show you how you’re travelling – is it a blip, a drift or a shift? Let Walter show the way.
Connect
Walter can import data from anywhere, at any time
Access data from sources such as SQL, Excel, SharePoint, PowerBI either as part of a timed configurable process, or in a one-off action
“Set and forget” – Walter imports data, then reports the results, logs errors and automatically updates reference data, so that you’re always up-to-date
Real-time or a day later, whenever suits you best
Set up as many imports as you need Process Behaviour Charts
Subscribe to Walter over the net

At a glance
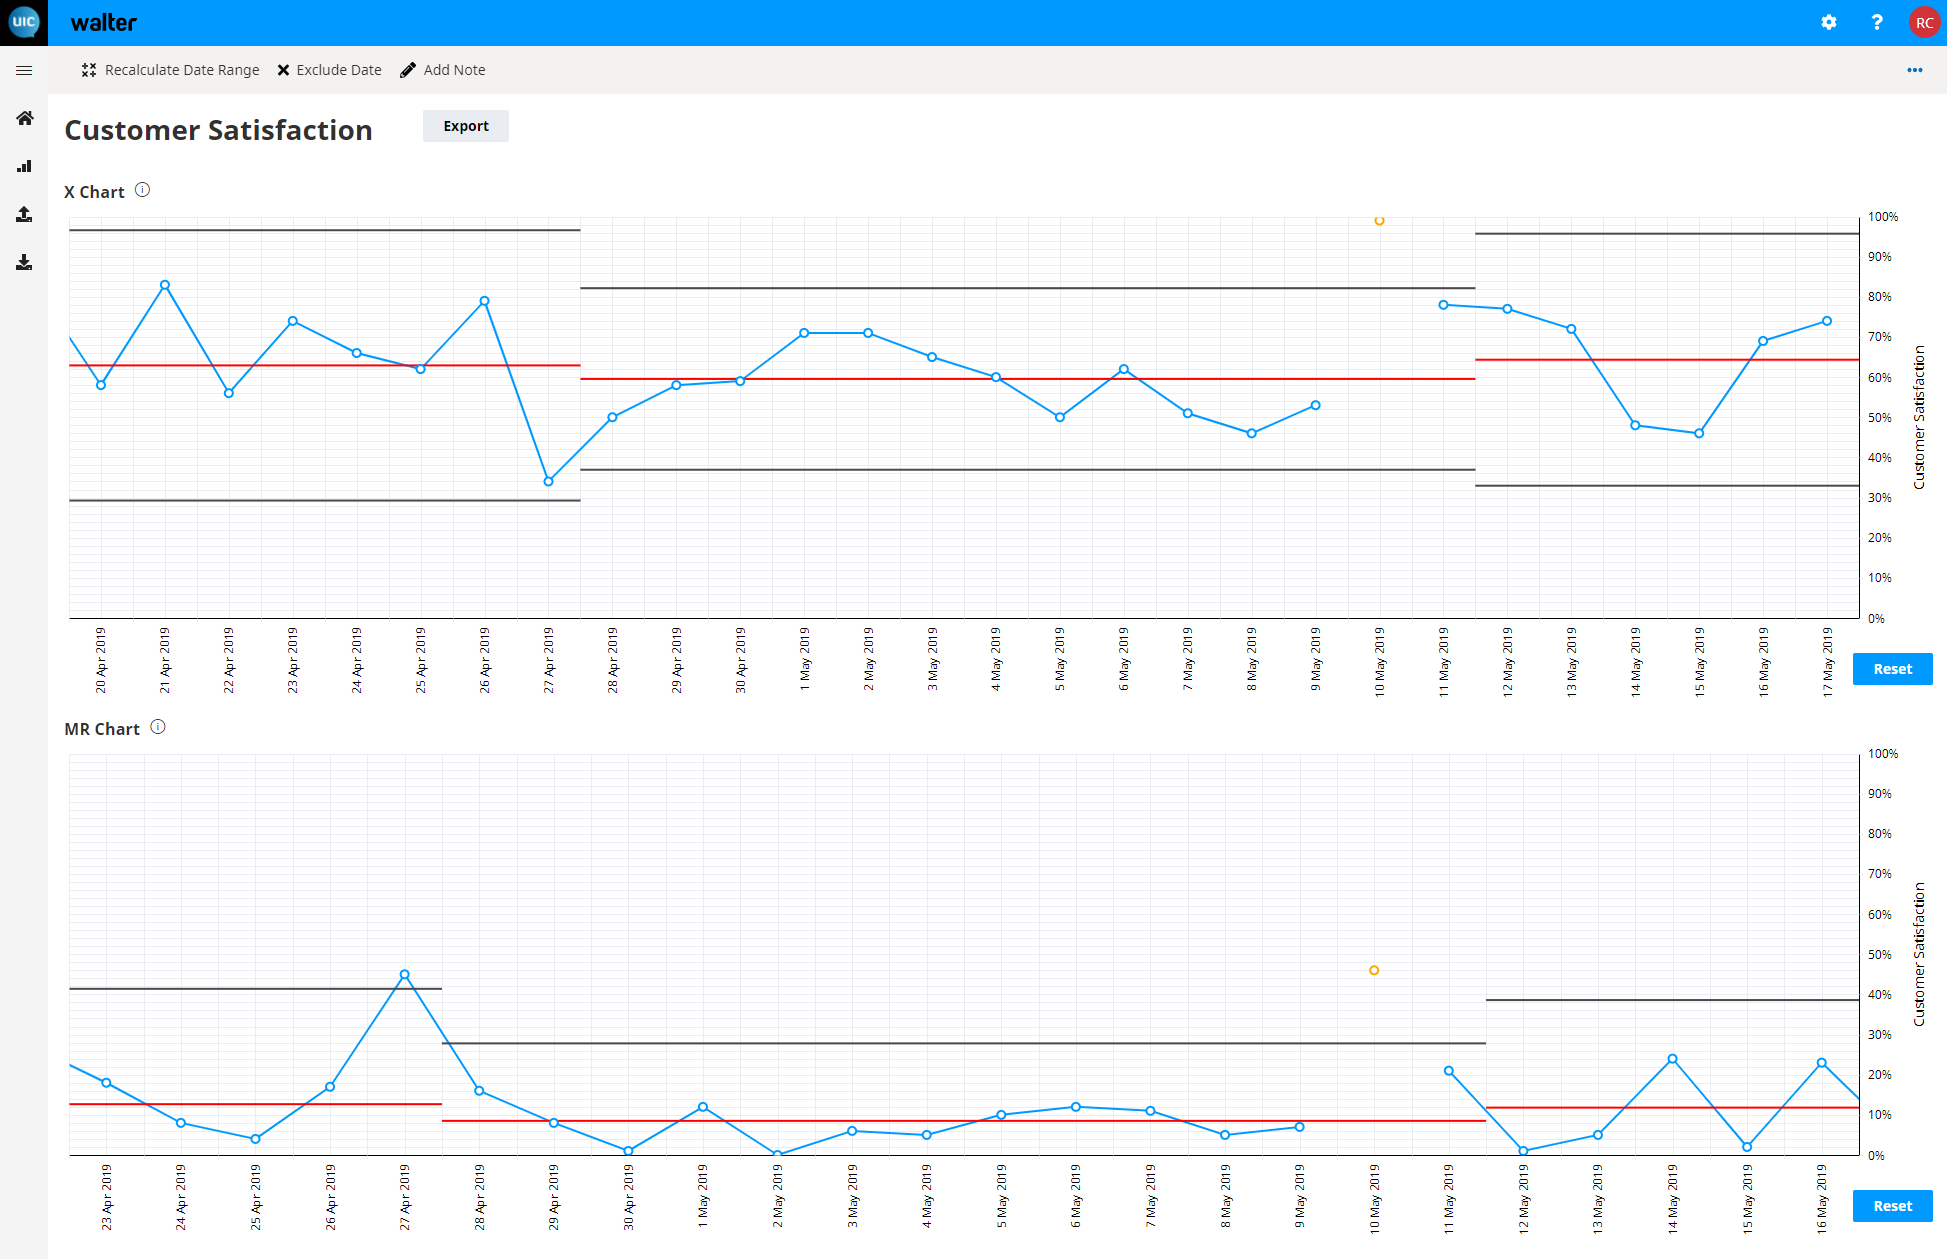
Upper and lower control lines show where a process has gone out of control, whether an event is common or special cause, giving you the confidence to either act or continue to observe
Reset your process by easily recalculating control limits for a date range, or exclude events which are outliers
Histograms for each control limit region assist in giving you an idea of how the data is spread out. Not sure if the control limit is right? Try setting up a custom Histogram for a date range and filter selection on the Histogram Page.
Easily switch between Process Behaviour Charts in the Dashboard and pan and zoom to get to grips with your processes
